How to...
How to profile a PCN population

This site is intended for health professionals only
It can be challenging to understand the different populations in areas of great diversity, especially in fast-changing cities, but that information is crucial to decision-making. Leeds City Council is tackling the issue by using data to create a health profile for each PCN. Lauren Turnbull, health improvement specialist in public health at Leeds City Council, explains how they’ve done it.
Leeds is a diverse city, where populations differ hugely between areas. The differences in geography and economic and social conditions across the city lead to large inequalities in health and wellbeing. People in the poorest part of Leeds live more of their lives in ill health and die around 12 years earlier than people in the most affluent part of the city.
As a large, global city, Leeds is also home to large numbers of people from communities with specific health needs that are often present in much smaller numbers in other local authorities. These include refugees and people seeking asylum, specific ethnic groups such as Gypsy, Roma and Traveller communities, LGBT+ communities, people who are homeless and a large student body. This means that as well as bringing a range of assets and opportunities to the city, there are large numbers of people who can benefit from tailored support on priority health issues.
So, a year ago, when public health and the PCNs identified that there was sometimes a limited understanding of the populations in the PCN footprint, Leeds City Council decided to act.
We knew any action taken needed to strengthen evidence-based planning for PCNs. It also needed to ensure that, where possible, targeted interventions were driven by data and a robust understanding of the PCN populations and the wider determinants of health.
The project was led by health improvement principal Leisa Batkin, public health intelligence manager Suresh Perisetla, and public health information specialist Quenby Harley. They were supported by me (Lauren Turnbull) as health improvement specialist and all at public health in Leeds City Council. An earlier version of the project was previously supported by health improvement specialist Annie Frecklington.
Aims
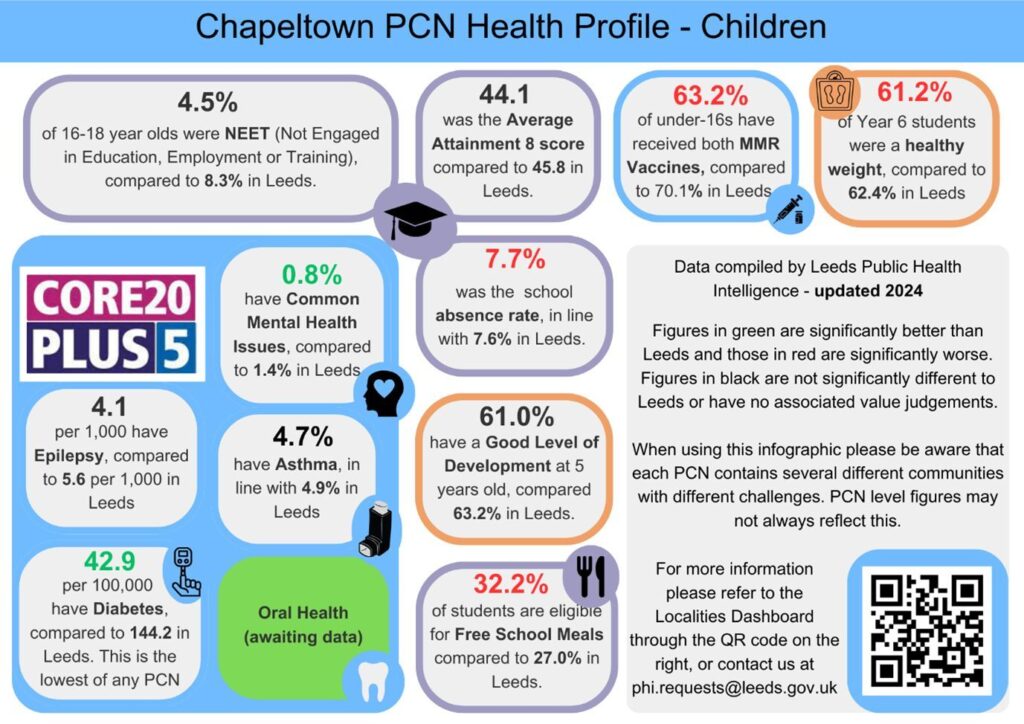
In Leeds, there are 88 GP practices, which care for around 900,000 people, covered by 19 PCNs. The aim is to create and share a personalised health profile in the form of an infographic for each PCN, which will display high-level data to inform meaningful priority setting and action planning. We show the figures in the context of the city average to indicate the statistical significance, which allows PCNs to clearly identify areas that may require additional action and intervention.

This project has been able to develop through successful collaboration and consultation with other partners and partnerships, such as the West Yorkshire ICB, GPs, and Local Care Partnerships (LCP).
For example, it was identified during conversations with the LCP and wider system collaboration that having a particular focus on children would be beneficial. Therefore, we have chosen to create two separate infographics for each PCN, one for adults and one for children, allowing for a more focused understanding of the different groups.
We have prioritised analysing data and producing eight infographics for the PCN areas of highest deprivation – those with an Index of Multiple Deprivation (IMD) 1 rating. We will then go on to create them for all 19 PCNs, as we recognise that there are areas of need and challenges in all areas.
Methods
Profiling a PCN entails collating data from a wide variety of indicators. So, to optimise potential, the project utilises partnerships between public health and PCNs, as well as the strong data sets and data-sharing agreements available in Leeds. We worked with teams across the council, including those in housing and children’s services, who offered access to data and invaluable insights.
The structure of the infographic is built around Core20plus5, and these data indicators are included as standard. This ensures that it remains connected to NHS drivers for targeted action.
In addition, we include data on indicators relating to the social determinants of health that are not usually identified within the medical model of primary care. For example, we made use of publicly available fuel poverty data and worked with colleagues across the council to include schooling data, such as average attendance. These are included where analysis suggests there are specific outliers in the data for that specific PCN.
This means that each health profile is unique and meaningful to that PCN, covering key indicators from the life course of adults and children.
Analysis and outcomes
The infographics have already been piloted for Chapeltown PCN and discussed as an example of good practice when Tom Pursglove, the then Minister of State for Disabled People, Health and Work visited us.
Although undoubtedly valuable, there have been some challenges. Data collection, collation, and processing is a time-consuming exercise. Even securing datasets for all the chosen indicators, especially social determinants, has taken a lot of time and required ongoing communication with various organisations and teams to locate and share the data.
Once data is secured, analysis is also lengthy and requires specialist skills from the public health intelligence team. Bringing all the data together has taken over six months. The first profile took around two days as we refined the format and wording. They now take 2-3 hours. Costs have been absorbed within our workstreams.
The creation of the infographics has also presented some challenges. It is designed on a web-based platform, which has limitations on presentation styles and requires a paid version to use its features fully. It has also been tricky to fit adult and child content to include key insights within a limited space without compromising on quality.
We are using these infographics to develop and mobilise emerging projects and build on existing relationships with a shared understanding of each PCN’s health needs. This work is an ‘entry level’ to the more developed health needs assessments that are currently being undertaken in our communities by public health localities and the primary care team. Their recommendations will hopefully form emerging topics as a collaboration between public health, local care partnerships and the PCNs.
Future
Work will continue to complete infographics for all PCNs – we hope to finish them in autumn 2024. Each profile will be used to support priority setting, particularly for the PCN health inequality leads as part of their ongoing work to implement change that will reduce the impact of health inequalities in their area. Based on the issues and needs identified in each PCN we will strive to support PCN colleagues by connecting them with any appropriate public health or other council teams who can support their development work.
As Leeds is a Marmot city, the profiles are not isolated, but instead sit among a range of projects built around population health and reducing health inequalities. The infographics will link to wider work happening in the city.
For example, the Tackling Health Inequalities Group (THIG), which was established by the Leeds Health and Care Partnership Executive Group, developed a health inequalities toolkit to help health, care and voluntary organisations in our system. The infographics will support PCNs when using the toolkit by helping them with prioritising and action planning.
And the infographics will continually evolve to reflect a changing picture. The health inequalities action learning group supported by a collaborative leadership team from primary care, the Leeds GP confederation and public health will hold regular reviews, and the data will be reassessed annually to identify and explore changes and outliers.
Other ongoing collaborative developments include a project where public health colleagues are working with the ICB and a local GPs to build a health inequalities clinic template on SystmOne and Emis.
Register today for full access to Pulse PCN content, and to receive weekly newsletters
Sign up nowIMPORTANT LINKS
MORE FROM COGORA
© Cogora 2025
Cogora Limited. 1 Giltspur Street, London EC1A
9DD Registered in the United Kingdom. Reg. No. 2147432